
Published January 5th, 2022 by Assaf Trafikant
How to Blend Data Sources in Google Data Studio [updated 2022]
What Is “Blend” In Data Studio
As you know, Google Data Studio can show a lot of metrics and charts with one limitation: Each data component is bound to only one data source. One component shows the total ‘cost’ from Facebook Ads, and another component shows the total ‘cost’ from Google Ads. Still, by default, Google Data Studio cannot SUM the values and show the SUM as one KPI. Why? Because Google can’t identify the ‘key’ that connects these two metrics. Google needs a rule, a guideline, to help it sum the correct values. So, saying to Google: “Listen, take Facebook Ads cost and add it to Google Ads cost” won’t work.
The only way to do it is to tell Google the following:
Listen, take Facebook Ads cost and add it to Google Ads cost, and use the ‘date’ as a key.
So now Google can take each day’s cost from Facebook Ads and the equivalent from Google Ads, and do the calculation, simply because it has the ‘key’ to match the records from both data sources.
How “ Blend ” Works?
To understand how it works, you need to know something about blending data in general, not only using Google Data Studio. Let’s start with a simple example of two data sources – Facebook Ads and Google Ads. I wish to fetch the data between 1 and 10th of January 2022. Since none of the platforms worked each day (just for the sake of the example), I get these results when fetching the data separately:

As you can see, the dates are not aligned. On 1/1/2022, we had both platforms running ads. On the 2nd, Only Facebook ads were active, and on the 7th, only Google. When fetching the data separately, the tables look just fine. But now I wish to combine the tables to answer the simple question: What is the total daily ad spent, cross-platform.
We have four different ways to combine these tables into one in the data business. This technique is called “JOIN.”
Inner Join
“Inner join” means that we “merge” only the rows with the same key on both tables. The ‘key’ here is the date, and that’s the result we get:

As you can see, only three days have ‘cost’ on both platforms; hence, these are the days that we take into the total cost calculation. What about the rest of the rows (with the red background)? Well, they stay out.
Left Join
“Left join” means that we take all the rows from the left table and “merge” the data only with the equivalent rows on the right table. That’s the result we get:

As you can see, the output table shows 100% of Facebook data, but only part of Google’s data.
Before we move on, You’ve probably noticed the left/right thing. Who cares about the side of the tables? Well, most BI platforms do care, and you should too. Order matters. So in Data Studio, when you add data sources, you must set which is left and right.
A quick fact: Until February 2022, “left join” was the only ‘join’ type Google Data Studio supported!
Right Join
As you can guess, ‘right join’ is exactly like ‘left join’ but this time, it takes all the rows from the right table and merges only with the equivalent from the left table. And that’s the result:

Full Join
It’s easy to notice that none of the above works well for our goal, and the final “merged” table shows partial dates with partial costs. So, let me introduce you to the Full join.
Full join takes all the rows from both tables. If we find a match, great, we can calculate the total cost. But if we don’t see a match, no matter from which table – who cares! Let’s put it anyway ?
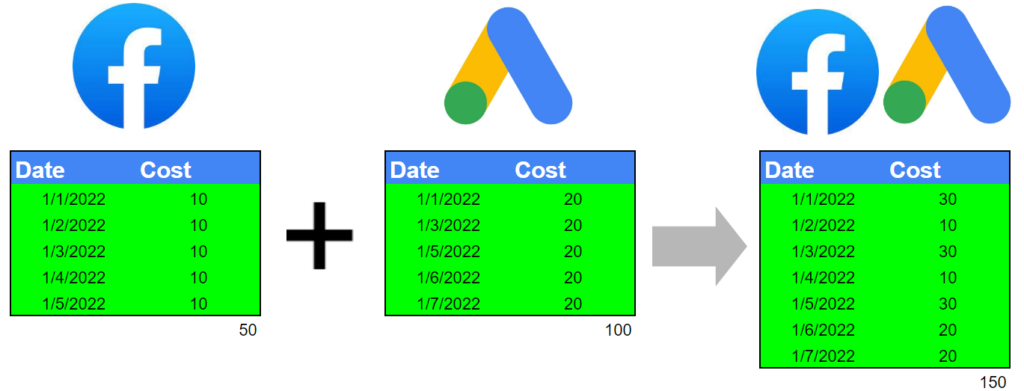
Yes! We got a perfect table with all the correct numbers in the right place. Remember this type of join. You’re going to use it a lot.
Cross Join
Cross join is a tricky one and I believe you will not use it on your marketing dashboards, but, since Google Data Studio supports it – let’s give it a shot.
Cross Join, simply takes the number of rows in the first table, and multiply it by the number of rows in the second table. In my example, we have 3 rows in Table1 and 2 rows in Table2. Cross Join multiples it and generates 6 tables with all the values separated into different columns:

The Key
In my examples above (excluding cross join), it’s easy to see that the key to match the tables was the ‘date.’ Let’s elaborate on it:
- You need to define a ‘key’ – without it, Google Data Studio cannot understand how to do the match.
- The ‘key’ does not have to be the ‘date’ (although it’s the most popular key.) It can any other field that exists in both tables. It can be campaign name, country, hour – whatever. Plus, it doesn’t have to have the same name on both platforms! If you tell Data Studio that Facebook Ads “ad set name” is the equivalent of “ad group name” from Google Ads – Then that’s the key and Data Studio will do its best to make the match.
- Key can be a set of multiple conditions (multiple keys!). You can choose the “date” but you can also choose date+country. Two keys that act as one.
Blend More Than Two Tables
The examples above show only two tables because it’s easy to understand, but you can add more tables to the party. Just be aware of the JOIN type you select. If you have three tables and choose “left join,” then the middle table acts as the ‘left‘ table of the right one. If you prefer, right join, then the middle table serves as the right table of the left one.
Important: Blending multiple tables allows you to choose different keys each time. So between tables 1 & 2, there’s one key, e.g., “campaign name,” while between tables 2 & 3, the key can be “Transaction ID.” It doesn’t have to be the same key for all tables.
Blend Tables Without Calculations
Until now, I have blended the data to show the total cost, across several ad networks, but what if I don’t want to do it? What if I want to show one metric from Data Source1 and another metric or dimension from Data Source2, and that’s it? You can do it quickly. I’ll show you how in a moment.
How To Blend Data Sources in Google Data Studio – The Full Guide
The ingredients:
- Understanding the join type and keys (check!)
- Google Data Studio (check!)
- Several data sources
- Knowing which fields I wanna pull from each data source
- Knowing what is the “key”
- Knowing the type of ‘join’ I need. If it’s left or right join – deciding which is the left or right table.
I’ve created two data sources for the blend, all from Google Sheets, but of course, you can use any data source you want.
Data Source 1 – I have a “cost” and the number of emails received by that ad network for each date.

Data Source 2 – I have a “cost” and a “country” dimension for each date.

My goal:
Create one table with all the fields from both tables, using the “date” as the key, and calculate the total cost.
Step 1 – Connecting The Data Sources.
If you’re here, reading how to blend in Google Data Studio, you probably already know how to connect data sources to data studio. So let’s pretend I showed you how, and let’s move on to add both tables to Data Studio canvas, making sure the data is correct:

It looks good. Let’s start the join process to create the third table.
Step 2 – Blend Setup
Go to menu item “Resource” -> “Manage blended data” and click “Add a Data View.”
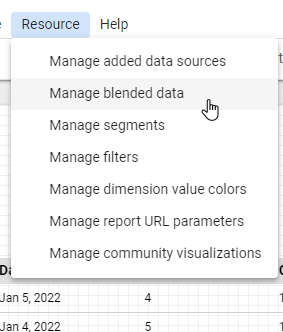
And you’ll get this screen:

- I choose “blend example 1” as the first (at left most) data source.
- Dragged the “date” to the Dimensions list and Date range area so you can later add a date range picker.
- Dragged the “email” and “cost” to the Metrics list.
Now I’m ready to add the “right” table by clicking the “Join another table” button on the right side (Remember? join action needs a left & right table.)
Same as before, I select the “cost” metric (the only metric I have here), Date & Country as dimensions, and also “date” as of the date range field so you can add a date range picker that works.

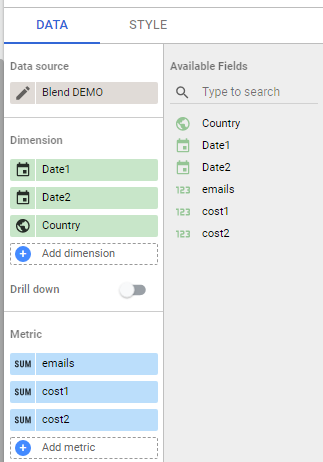
Before we move on, please note that we have two metrics with the same name, “cost.” That will work for you pretty well, but if you need to add a calculation based on these two fields (like aggregated cost), Google Data Studio cannot identify which is which. So, click on the SUM icon next to each of them, and change their name to “cost1” and “cost2” or whatever.
I also recommend doing it to the “Date” dimensions. Call them date1, date2.
Now, something is missing. Where is the “key” between the tables?
Step 3 – Blend Type
Click on the nice Venn diagram icon between the tables to get this:

As you can see, we get all four types of “join,” as I showed at the beginning of this guide. Choose the blend type you need, and for the example, I will choose the “Full Outer Join.” In addition, Data Studio asks you for the “Join Conditions,” which means – what is the key? So, my setup goes like this (please note that you can have more than one key):

And now, let’s click “Save” and look at the right side of the screen that will show you the final “blended” table with fields from both tables.

On top, give this blended table a name (I called it “Blend DEMO”). Click “Save” and “close” to go back to the canvas.
Step 4 – Check The Blend
Just for the test, I’ve created a new data table, connected it to the blended data source, selected all the dimensions and metrics, and dragged them to the correct place.
And the final table should look like this:

As you can see, we have seven rows, and we got a lot of nulls. This happens when Google Data Studio “tries” to fill the gaps.
These “null” values will cause us a big headache, visually and later, when we want to run some calculations.
Step 5 – Fixing The Blend
My goal now is to show a total cost instead of cost 1&2 and merge dates 1&2 together. This will also fix the ‘null’ issue.
- Click on our new merged table.
- Add a new metric, but instead of choosing an existing one, click on “Create new field”

Let’s call the new field “Total cost,” and type the following formula:
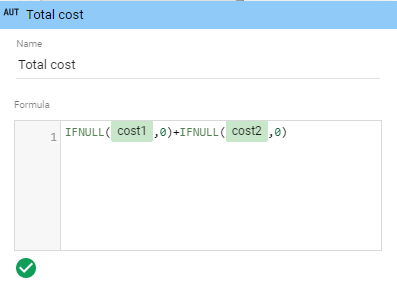
IFNULL(COST1,0)+IFNULL(COST2,0)The formula says, take cost 1 (but if it equals null, then use zero instead) and add it to cost 2 (if it equals null, then use zero instead.)
In addition, we need to overcome the NULL value in the date 1&2 fields. Click on “add dimension” and then “Create Field.”

Call the new field “Date” with the following formula:

IFNULL(DATE1,DATE2)The formula says, take date1, but if it’s NULL, take date2. I applied the same logic on the “country” field or any other field with NULL values.
If this formula does not work, try to use the “coalesce” function. The formula coalesce(field1,field2,field3…) tells Google to take field 1, but if it does not exist, take field 2 etc.
Now, remove date1, date2,cost1,cost2, or any other redundant fields from the table, and you’ll get this:

And there you have it! You know how to blend!